What is Azure Arc Insights?
Azure Arc Insights (also known as VM Insights for Arc-enabled servers) extends Azure Monitor's powerful monitoring capabilities to your hybrid and multi-cloud infrastructure. VM Insights provides deep visibility into the performance, health, and dependencies of Windows and Linux servers connected via Azure Arc, delivering the same monitoring experience as native Azure VMs.
VM Insights combines two critical monitoring dimensions: Performance metrics for resource utilization analysis and dependency mapping for understanding application architecture and network connections. This unified view enables proactive troubleshooting, capacity planning, and security auditing across your entire hybrid estate.
Core components
- Azure Monitor Agent (AMA): Collects performance counters, logs, and metrics from the guest operating system and sends them to Log Analytics workspace.
- Dependency Agent: Discovers running processes, network connections, and dependencies between machines to enable the Map feature.
- Data Collection Rules (DCR): Define what data to collect, sampling frequency, and destination Log Analytics workspace.
- Log Analytics workspace: Stores collected telemetry in structured tables (InsightsMetrics, VMProcess, VMConnection, etc.) for querying and alerting.
Key benefits
1. Unified monitoring across hybrid infrastructure
Monitor Azure VMs, Arc-enabled servers (on-premises, multi-cloud, edge), and Virtual Machine Scale Sets from a single interface. No need for separate tools like System Center Operations Manager (SCOM) or third-party monitoring solutions—Azure Monitor provides consistent visibility regardless of where your servers run.
2. Performance analysis and troubleshooting
The Performance view provides curated dashboards with time-series charts for CPU, memory, disk I/O, network throughput, and logical disk performance. Quickly identify resource bottlenecks, compare performance across server groups, and drill down to specific time ranges when issues occurred.
3. Dependency mapping and service discovery
The Map view automatically discovers and visualizes running processes, listening ports, inbound/outbound network connections, and dependencies between machines. This is invaluable for understanding application topology, impact analysis before changes, and troubleshooting connectivity issues.
4. Automated data collection and simplified onboarding
VM Insights automates agent deployment and creates default data collection rules with best-practice metrics. You can enable monitoring with a single click in the portal, or at scale via Azure Policy, without manually configuring counters or log sources.
5. Integration with Azure Monitor ecosystem
VM Insights data is stored in Log Analytics, enabling custom KQL queries, correlation with other Azure Monitor data sources (Application Insights, Container Insights), alert rules, workbooks, and dashboards. Extend monitoring to include custom logs, events, and application-specific metrics.
6. Cost optimization
By default, VM Insights collects only essential performance metrics. You can disable dependency collection (Map feature) to reduce data ingestion costs if process tracking is not required. Data retention policies and workspace commitment tiers help manage long-term storage costs.
Understanding the Performance view
The Performance tab in VM Insights displays predefined charts for the most critical performance counters collected from the guest operating system. These charts show trends over time (default: last 6 hours, configurable up to 30 days) and support multi-machine comparison.
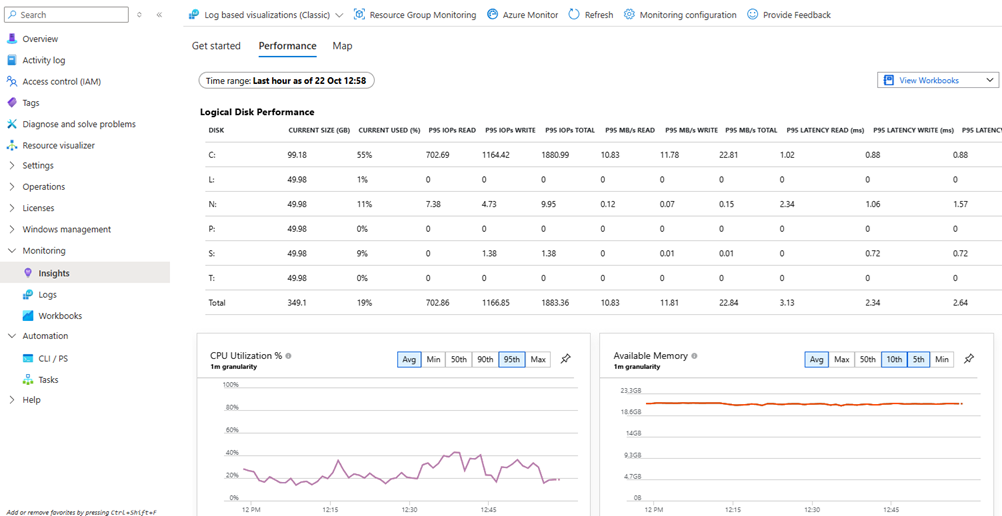
Performance metrics collected (default)
- CPU Utilization %: Processor time across all cores, aggregated at 60-second intervals.
- Available Memory MB: Free and available memory for new processes.
- Logical Disk IOPS: Read/write operations per second across all volumes.
- Logical Disk MB/s: Throughput (megabytes per second) for disk I/O.
- Logical Disk Latency ms: Average read/write latency per disk operation.
- Network Bytes Sent/Received: Network traffic volume over time.
- Logical Disk Space Used %: Capacity utilization per volume.
All performance data is sent to the InsightsMetrics table in Log Analytics,
where you
can write custom KQL queries for advanced analysis, percentile calculations, anomaly
detection, or
correlation with application logs.
Pro tip: Use the Performance view's time-range picker and aggregation options to correlate performance spikes with specific events (deployments, batch jobs, user activity peaks). Export charts to Azure Dashboards or pin to custom workbooks for executive reporting.
Understanding the Map view
The Map feature provides interactive visualization of application topology, running processes, and network dependencies. It requires the Dependency Agent in addition to Azure Monitor Agent.
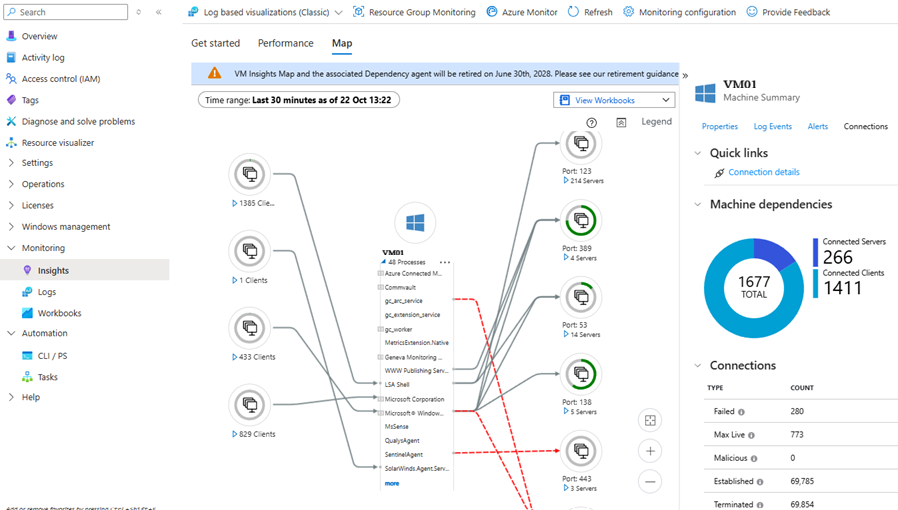
What the Map shows
- Running processes: All active processes on the machine, expandable to view command lines, CPU/memory usage per process, and process hierarchy.
- Network connections: Active TCP connections (inbound and outbound), grouped by remote IP, port, and protocol. Visualizes which machines or external services communicate with this server.
- Server ports: Listening ports and the processes bound to them, including port numbers and protocols.
- Failed connections: Connection attempts that failed (network errors, refused connections, timeouts), useful for diagnosing firewall rules or service outages.
- Time-based playback: View dependencies over a specific time range (e.g., during an incident) to see which connections existed at that moment.
Map data tables (Log Analytics)
The Dependency Agent populates four Log Analytics tables:
VMProcess: Inventory of running processes, including name, path, user, start time, CPU/memory usage.VMConnection: Details of network connections (source/destination IP, port, bytes sent/received, latency).VMBoundPort: Server ports bound by processes (listening ports).VMComputer: Machine inventory metadata (OS, timezone, boot time, DNS name).
Use case example: When troubleshooting an application issue, the Map view can show you if the web server is connecting to the database server on the expected port, identify rogue processes consuming CPU, or discover unexpected external connections that may indicate compromise.
Prerequisites
- Arc-enabled servers: Machines must be onboarded to Azure Arc-enabled servers. See Onboard Servers to Azure Arc for guidance.
- Log Analytics workspace: A workspace to store collected telemetry. Can be shared across multiple servers or dedicated per environment.
- Supported operating systems:
- Windows Server 2012 R2, 2016, 2019, 2022 (64-bit)
- Windows 10, 11 (64-bit, domain-joined)
- Ubuntu 18.04, 20.04, 22.04 LTS
- Red Hat Enterprise Linux (RHEL) 7, 8, 9
- CentOS 7, 8; Rocky Linux 8, 9
- SUSE Linux Enterprise Server (SLES) 12, 15
- Debian 9, 10, 11
- Network requirements:
- Outbound HTTPS (TCP 443) to Azure Monitor endpoints (global or via Azure Private Link)
- Dependency Agent does not require additional ports (uses Azure Monitor Agent channel)
- Optional: Log Analytics Gateway for machines without direct internet access
- Permissions:
- Contributor or Virtual Machine Contributor on the Arc machine resource to deploy extensions
- Monitoring Contributor to create data collection rules and associate them with machines
- Log Analytics Contributor on the workspace to configure data collection
Important: VM Insights with Azure Monitor Agent is the modern monitoring solution. If your machines currently use the legacy Log Analytics agent (MMA/OMS), migrate to Azure Monitor Agent to avoid duplicate data collection and ensure future support.
Enable VM Insights via Azure Portal
The Azure portal provides a streamlined workflow to enable VM Insights on unmonitored Arc-enabled servers.
Step-by-step procedure
- Navigate to Azure Monitor:
- In the Azure portal, go to Monitor → Virtual Machines.
- Select the Not Monitored tab to view Arc-enabled servers without VM Insights.
- Select machine to enable:
- Click Enable next to the Arc-enabled server you want to monitor.
- The machine must be running to enable monitoring.
- Choose monitoring configuration:
- On the Insights Onboarding page, select Azure Monitor agent (recommended).
- Choose an existing Data Collection Rule or select Create New.
- Configure data collection rule:
- Provide a Data collection rule name (e.g.,
DCR-VMInsights-Production). - Enable Guest Performance: Always required for VM Insights (performance counters).
- Enable Processes and Dependencies (Map): Check this box if you want the Map feature. This installs the Dependency Agent and collects process/connection data.
- Select the Log Analytics workspace for data storage.
- Provide a Data collection rule name (e.g.,
- Review and create:
- Click Create to create the DCR, then Configure to deploy agents.
- The portal deploys Azure Monitor Agent and (optionally) Dependency Agent VM extensions to the Arc machine.
- Agent deployment typically takes 5-10 minutes. Data collection begins immediately after installation.
- Verify deployment:
- Go to the Arc machine → Extensions blade to confirm
AzureMonitorWindowsAgent(orAzureMonitorLinuxAgent) andDependencyAgentWindows(orDependencyAgentLinux) are installed and running. - Navigate to Arc machine → Insights to view Performance and Map tabs.
- Go to the Arc machine → Extensions blade to confirm
Quick win: For uniform monitoring across an environment, create one VM Insights DCR and reuse it for all machines in the same workload tier (e.g., production, dev/test). Use Azure Policy to auto-assign the DCR to new Arc machines as they onboard.
Enable VM Insights via Azure CLI
Use Azure CLI to enable VM Insights programmatically or at scale via scripts and automation pipelines.
Prerequisites for CLI
# Ensure Azure CLI is installed and logged in
az login
az account set --subscription <subscription-id>

# Register required resource providers (if not already registered)
az provider register --namespace Microsoft.Insights
az provider register --namespace Microsoft.HybridCompute
1) Create a Data Collection Rule for VM Insights
# Variables
RG=<resource-group>
LOCATION=<region>
DCR_NAME=<dcr-name>
WORKSPACE_ID=<log-analytics-workspace-resource-id>

# Create the DCR with performance counters (Map feature disabled)
az monitor data-collection rule create \
  --name $DCR_NAME \
  --resource-group $RG \
  --location $LOCATION \
  --rule-file vminsights-dcr-basic.json

# Sample vminsights-dcr-basic.json (performance only, no dependencies)
# See Microsoft Learn docs for complete JSON schema
Note: The Azure CLI
does not yet have a native command to create VM
Insights-specific DCRs.
Use the portal to generate a DCR first, then export it as JSON and deploy via CLI using
az monitor
                                data-collection rule create --rule-file
. Alternatively, use ARM templates or
PowerShell.
2) Install Azure Monitor Agent extension
# Variables
ARC_MACHINE=<arc-machine-name>
RG=<resource-group>

# Install Azure Monitor Agent for Windows
az connectedmachine extension create \
  --name AzureMonitorWindowsAgent \
  --publisher Microsoft.Azure.Monitor \
  --type AzureMonitorWindowsAgent \
  --machine-name $ARC_MACHINE \
  --resource-group $RG \
  --enable-auto-upgrade true

# Install Azure Monitor Agent for Linux
az connectedmachine extension create \
  --name AzureMonitorLinuxAgent \
  --publisher Microsoft.Azure.Monitor \
  --type AzureMonitorLinuxAgent \
  --machine-name $ARC_MACHINE \
  --resource-group $RG \
  --enable-auto-upgrade true
3) Install Dependency Agent (optional, for Map feature)
# Install Dependency Agent for Windows
az connectedmachine extension create \
  --name DependencyAgentWindows \
  --publisher Microsoft.Azure.Monitoring.DependencyAgent \
  --type DependencyAgentWindows \
  --machine-name $ARC_MACHINE \
  --resource-group $RG \
  --settings '{"enableAMA": true}' \
  --enable-auto-upgrade true

# Install Dependency Agent for Linux
az connectedmachine extension create \
  --name DependencyAgentLinux \
  --publisher Microsoft.Azure.Monitoring.DependencyAgent \
  --type DependencyAgentLinux \
  --machine-name $ARC_MACHINE \
  --resource-group $RG \
  --settings '{"enableAMA": true}' \
  --enable-auto-upgrade true
4) Associate DCR with Arc machine
# Get the DCR resource ID
DCR_ID=$(az monitor data-collection rule show \
  --name $DCR_NAME \
  --resource-group $RG \
  --query id -o tsv)

# Get the Arc machine resource ID
MACHINE_ID=$(az connectedmachine show \
  --name $ARC_MACHINE \
  --resource-group $RG \
  --query id -o tsv)

# Create DCR association
az monitor data-collection rule association create \
  --name "DCR-VMInsights-Association" \
  --rule-id $DCR_ID \
  --resource $MACHINE_ID
Enable VM Insights via PowerShell
PowerShell provides similar capabilities to CLI with native Azure PowerShell cmdlets.
Prerequisites for PowerShell
1) Install Azure Monitor Agent extension
2) Install Dependency Agent extension (optional)
3) Associate DCR with Arc machine
Bulk enablement:
Use the PowerShell Gallery script
Install-VMInsights.ps1 to enable VM Insights across multiple Arc machines
at scale.
The script supports resource group scoping, wildcards, and parallelization for large
environments.
Real-world use cases
Use case 1: Performance troubleshooting during peak load
Scenario: A web application experiences slow response times during business hours. The application runs on Arc-enabled servers hosted on-premises.
Solution with VM Insights:
- Open the Performance view and set the time range to the incident window (e.g., 9:00 AM - 11:00 AM).
- Identify that CPU utilization spiked to 95% on two web servers while database server CPU remained low.
- Drill into logical disk IOPS charts to see if disk contention contributed to the bottleneck (it did not).
- Switch to the Map view and expand the processes on the affected web servers.
- Discover a scheduled backup process (PowerShell script) was running concurrently with peak user traffic, consuming CPU resources.
- Resolution: Reschedule the backup to off-peak hours. Performance returns to normal.
Use case 2: Dependency mapping before migration
Scenario: Planning to migrate a legacy on-premises application to Azure. Need to understand which servers communicate with each other and on which ports.
Solution with VM Insights:
- Enable VM Insights with Map feature on all application servers (web, app, database tiers).
- Let the Dependency Agent collect data for 7 days to capture full traffic patterns.
- Use the Map view to visualize the entire application topology:
- Web servers connect to app servers on TCP 8080
- App servers connect to database server on TCP 1433 (SQL Server)
- App servers also connect to an external SMTP relay on TCP 25 for email notifications
- Unexpected connection: Web servers directly query a file server on SMB (TCP 445)
- Query
VMConnectiontable in Log Analytics to export connection details (source/destination IPs, ports, byte counts). - Outcome: Build accurate Azure network security groups (NSGs), plan for Azure Files migration to replace SMB share, and document SMTP relay dependency for post-migration configuration.
Use case 3: Security auditing for unauthorized processes
Scenario: Compliance requirement to detect and alert on unauthorized software installations on production servers.
Solution with VM Insights:
- Enable VM Insights with Map feature (Dependency Agent) to collect process inventory.
- Write a KQL query against the
VMProcesstable to identify new processes not in an approved baseline:VMProcess | where TimeGenerated > ago(1d) | where ExecutableName !in ("approved.exe", "another.exe", "...") | summarize FirstSeen=min(TimeGenerated) by Computer, ExecutableName, ExecutablePath, UserName | where FirstSeen > ago(1h) | project Computer, ExecutableName, ExecutablePath, UserName, FirstSeen - Create a Log Analytics alert rule that triggers when this query returns results.
- Configure an action group to send email/SMS to security team or open a ticket in ServiceNow.
- Result: Security team is alerted within minutes when a developer installs a debugging tool on a production server without change approval.
Use case 4: Capacity planning for server consolidation
Scenario: Organization wants to reduce on-premises footprint by consolidating underutilized servers. Need objective data on resource usage.
Solution with VM Insights:
- Enable VM Insights on all candidate servers (no Map feature needed, saves costs).
- Collect performance data for 30 days to capture monthly cycles (month-end batch jobs, payroll runs, etc.).
- Use the Performance view to analyze:
- Average CPU utilization over 30 days (servers averaging < 20% are consolidation candidates)
- Peak memory usage (ensure consolidated servers have sufficient RAM headroom)
- Disk IOPS trends (identify if I/O intensive workloads require SSD)
- Export data to Excel or Power BI for executive dashboards showing potential cost savings.
- Outcome: Safely consolidate 15 lightly-loaded servers onto 5 higher-capacity VMs, reducing hardware refresh costs and simplifying management.
Use case 5: Multi-cloud monitoring consistency
Scenario: Enterprise runs workloads in Azure, AWS, and on-premises. Different teams use different monitoring tools (CloudWatch, Nagios, SCOM), making unified visibility difficult.
Solution with VM Insights:
- Onboard AWS EC2 instances and on-premises servers to Azure Arc-enabled servers.
- Enable VM Insights on all Arc machines (Azure, AWS, on-prem) using the same DCR and Log Analytics workspace.
- Create a single Azure Workbook that queries
InsightsMetricsandVMConnectiontables to show:- Fleet-wide CPU/memory trends by environment tag (Azure, AWS, on-prem)
- Top 10 servers by resource utilization (identify outliers regardless of location)
- Cross-cloud dependency map (e.g., Azure web app connecting to on-prem SQL Server)
- Benefit: Operations team has a single pane of glass for infrastructure monitoring, reducing tool sprawl and training costs. Standardized alerting across all environments.
Best practices and recommendations
1. Start with performance-only, add Map selectively
The Map feature (Dependency Agent) increases data ingestion costs. Enable it only for critical systems where dependency visualization adds value (application servers, database clusters). For file servers, domain controllers, or standalone services, performance metrics alone are often sufficient.
2. Use Azure Policy for consistent deployment
Assign the built-in Azure Policy "Configure Arc machines to run Azure Monitor Agent"
to automatically
deploy agents to new Arc machines. Use policy parameters to specify the DCR and
enable/disable Dependency Agent
based on machine tags (e.g., monitoring-tier=premium gets Map,
monitoring-tier=standard
gets performance only).
3. Optimize Log Analytics workspace design
- Centralized workspace: Use one workspace per region for easier querying and correlation.
- Commitment tiers: For high-volume environments (500+ servers), enable workspace commitment tiers to reduce per-GB ingestion costs.
- Data retention: Default 30 days is sufficient for troubleshooting. Extend to 90 days for compliance, or archive to Azure Storage for long-term retention at lower cost.
4. Set up proactive alerts
Create metric alert rules for common issues:
- CPU > 90% for 15 minutes (sustained load)
- Available memory < 500 MB (memory pressure)
- Logical disk free space < 10% (capacity risk)
- Process count anomaly (unexpected process starts/stops)
5. Leverage workbooks for custom visualizations
VM Insights includes pre-built workbooks (Performance, Map, Capacity). Clone and customize them to add:
- Business-specific metrics (e.g., application performance counters)
- Cost attribution by tag (charge back to business units)
- Compliance dashboards (patch status, agent health, data collection gaps)
6. Monitor agent health
Query the Heartbeat table to ensure agents are reporting:
Heartbeat
| where TimeGenerated > ago(1h)
| summarize LastHeartbeat = max(TimeGenerated) by Computer
| where LastHeartbeat < ago(15m)
| project Computer, LastHeartbeat, MinutesSinceLastHeartbeat = datetime_diff('minute', now(), LastHeartbeat)
Create an alert when this query returns results (agent not reporting for > 15 minutes).
7. Tag machines for dynamic scoping
Use Azure tags (environment:prod, app:web,
tier:frontend) to
dynamically filter VM Insights views and create environment-specific dashboards. Tags also
enable
conditional DCR assignment via Azure Policy.
Troubleshooting common issues
Machine not appearing in VM Insights
- Verify the machine is Arc-enabled and showing as Connected in Azure portal.
- Check that Azure Monitor Agent extension is installed and running (Extensions blade).
- Confirm the machine is associated with a VM Insights DCR (Monitor → Data Collection Rules → Resources tab).
- Allow 5-10 minutes after DCR association for data to appear.
Performance data visible but no Map view
- Verify the Dependency Agent extension is installed (Windows:
DependencyAgentWindows, Linux:DependencyAgentLinux). - Confirm the DCR has "Processes and dependencies" enabled.
- Check extension logs on the machine:
- Windows:
C:\WindowsAzure\Logs\Plugins\Microsoft.Azure.Monitoring.DependencyAgent.DependencyAgentWindows - Linux:
/var/log/azure/Microsoft.Azure.Monitoring.DependencyAgent.DependencyAgentLinux
- Windows:
- Restart the Dependency Agent service if necessary.
Data collection stopped after agent upgrade
- Check for extension auto-upgrade issues in the machine's Extensions blade (look for Failed status).
- Manually update the extension to the latest version via portal or CLI.
- Verify firewall/proxy rules did not change (Azure Monitor Agent requires outbound HTTPS
to
*.ods.opinsights.azure.comand*.oms.opinsights.azure.com).
Missing performance counters
- VM Insights collects a predefined set of counters. To collect additional counters (e.g., custom application metrics), create a custom DCR and add performance counter data sources.
- Query
InsightsMetricstable to see which counters are being collected:InsightsMetrics | distinct Namespace, Name.
Cost considerations
- No charge for agents: Azure Monitor Agent and Dependency Agent extensions are free. There is no per-server licensing cost.
- Log Analytics ingestion: You pay for data ingested into the Log Analytics workspace. VM Insights (performance only) typically generates 1-3 GB/server/month. Enabling Map feature adds 2-5 GB/server/month (depends on process churn and connection volume).
- Data retention: First 31 days included at no extra charge. Additional retention (up to 2 years) incurs per-GB charges. Archive tier for long-term retention is cheaper.
- Workspace commitment tiers: Discounts available when ingesting > 100 GB/day (capacity reservations starting at 100 GB/day, 200 GB/day, 500 GB/day, etc.).
- Query charges: No charge for querying data within retention period. Interactive queries are included; only large-scale export/archival queries may incur minimal costs.
Cost optimization
tip: Use Usage and estimated costs blade
in your Log Analytics
workspace to monitor daily ingestion by table. If
VMProcess/VMConnection tables
are growing rapidly, consider disabling Map on low-criticality servers.
Next steps
- Extend monitoring: Configure custom data collection rules to collect Windows Event Logs, Linux syslog, IIS logs, or application-specific performance counters.
- Integrate with Azure Update Manager: Use VM Insights performance data to identify servers with high uptime (candidates for patching/reboot during maintenance windows). See Azure Update Manager.
- Correlate with Change Tracking: Combine VM Insights performance anomalies with Change Tracking events (software installs, configuration changes) to identify root causes. See Azure Arc Inventory and Change Tracking.
- Enable Microsoft Sentinel integration: Ingest VM Insights data into Sentinel for security analytics, threat detection, and incident correlation across your hybrid estate.
- Automate response with Azure Automation: Trigger runbooks from Log Analytics alerts (e.g., when disk space is low, auto-expand volume or clean temp files).